What’s Ahead:
- Stocks tend to perform well with low volatility during the final stretch of the year.
- The CBOE Volatility Index (VIX) Futures Term Structure indicates that volatility could rear its ugly head again once 2023 gets underway.
- Global fund managers have grown increasingly concerned about a recession next year as the yield curve turns more inverted and leading economic indicators paint a bleak picture.
- Following a strong fourth quarter rally in risk assets, and with a low VIX, now could be an opportune time to add portfolio protection.
The holidays often are a time of reflection and appreciation that is much needed after another wild year in financial markets. It’s common to also see stocks rise as the new year approaches. According to data gathered by Bank of America Global Research, equity returns have been positive in December 75% of the time in data going back to 1928 with an average return of 1.36%.
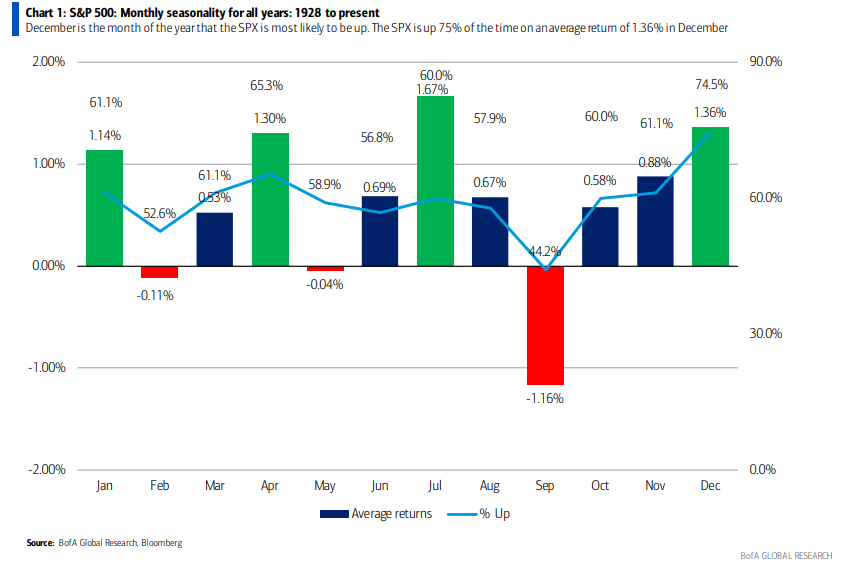
Volatility also tends to wane. The market’s standard deviation of returns drops from a high of 6.0% in October to just 3.4%, on a monthly basis, in December. For perspective, the annualized volatility of the S&P 500 tends to range from 18% to 20% over the long run. The VIX is Wall Street’s “fear gauge,” and it’s used to get a sense of how up and down stocks are. The measurement loses its cache during the often-calm weeks leading up to year-end.
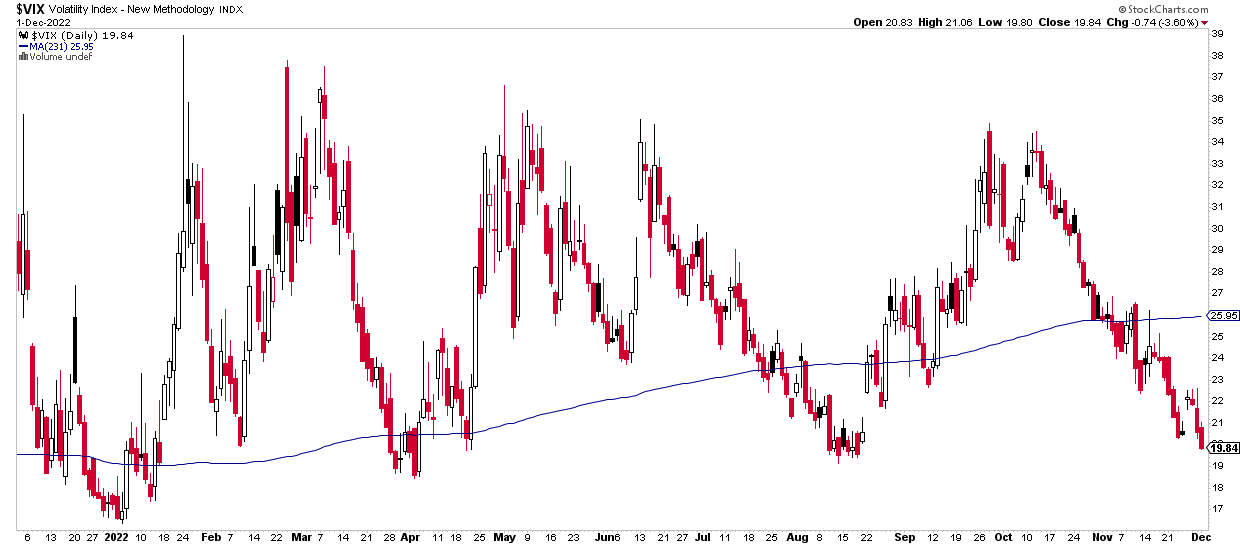
How do things shape up now? In early December, the VIX actually dipped below 20 – a rare occurrence in what has been an unusually volatile, but not unprecedented, year. Volatility has averaged near 26 in 2022 with a high of 39 back in January as stocks slid from their lone, all-time high notched on the first trading day of the year. Only four occasions featured a sub-20 VIX this year – early January, the start of the second quarter, and mid-August –, along with the current lull in volatility.
Holiday Cheer Brings a Drop in Volatility
With inflation showing signs of peaking, the Federal Reserve (Fed) perhaps easing off the brake pedal, and positive macro news out of China regarding that nation’s strict zero-COVID policy, is the coast all clear as investors embark on a new year? Not so much, at least according to the VIX futures curve.
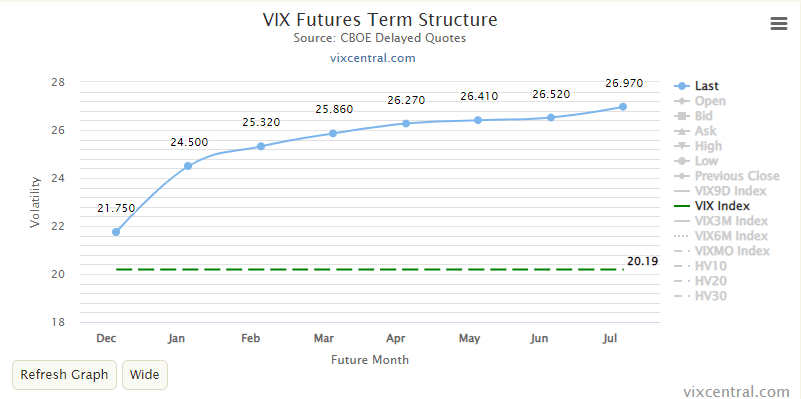
The chart below illustrates that the VIX market is a futures trading arena like many other commodities, interest rates, currencies, and stock market products. You can buy and sell wagers on what the VIX will be across a series of months. While the spot VIX is simply a statistic that measures the prices of near-dated puts and calls to capture an annualized standard deviation on the S&P 500, VIX futures contracts are what’s traded.
Currently, the VIX futures term structure, according to VIX Central data, is in somewhat steep “contango,” ora situation in futures markets during which near-term contracts are priced at a discount to forward prices. With volatility, it indicates that a temporary drop-off in big market swings is expected. Looking ahead, however, volatility returns once the doldrums of the holidays are in the rearview mirror.
Volatility Is “Tender and Mild” Now, But Expected to Be Higher in 2023
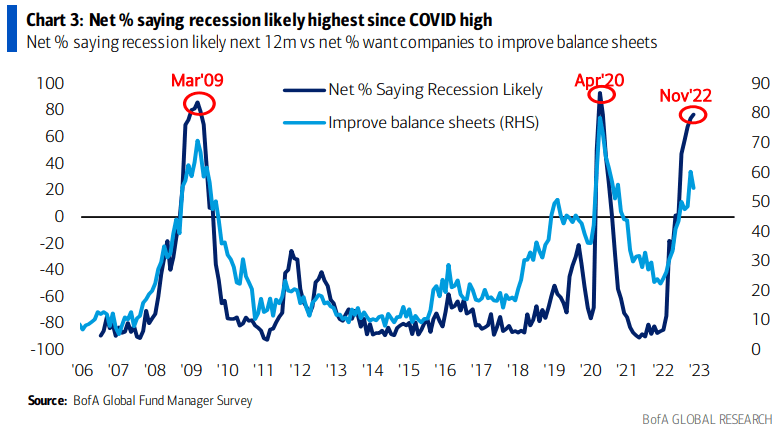
What might be driving this concern among options traders? Consider that inflation fears are indeed subsiding, but growing recession jitters are on the minds of portfolio managers and investors at large. The latest Bank of America Global Research Fund Manager Survey revealed that most professional money managers see negative economic growth in the coming 12 months. Specifically, the report found that a net 77% of respondents see a global recession in the offing.
Will Santa Leave a Recession Under the Tree? That Is the Consensus View.
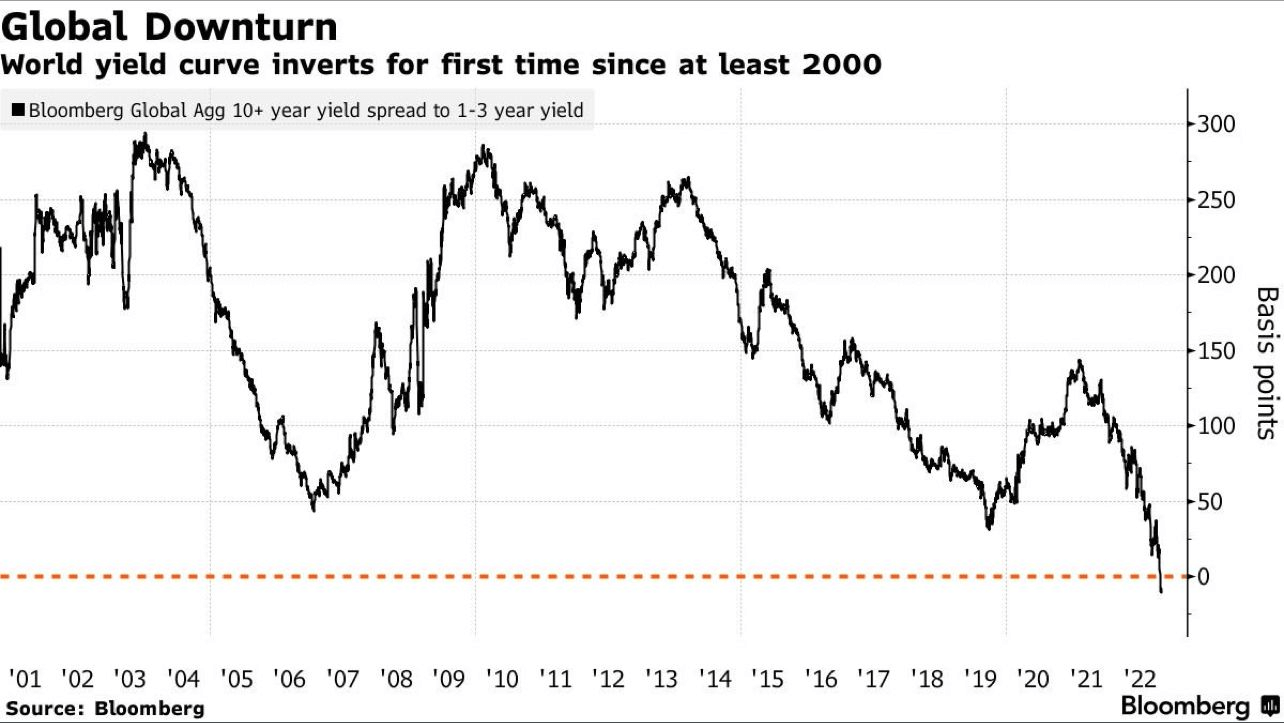
And it’s not just a feeling. One key predictor of incoming economic turmoil is the Treasury yield curve. The interest rate differential between the global aggregate 10+ year yield and the one- to three-year yield has dipped negative for the first time since at least the year 2000, according to Bloomberg. That comes as the U.S. “2s10s” deepens its months-long inversion. In fact, the U.S. 2-year rate is now more than 70 basis points higher than the yield on the 10-year Treasury note – the biggest inversion in about four decades.
Global Sovereign Yield Curves Invert
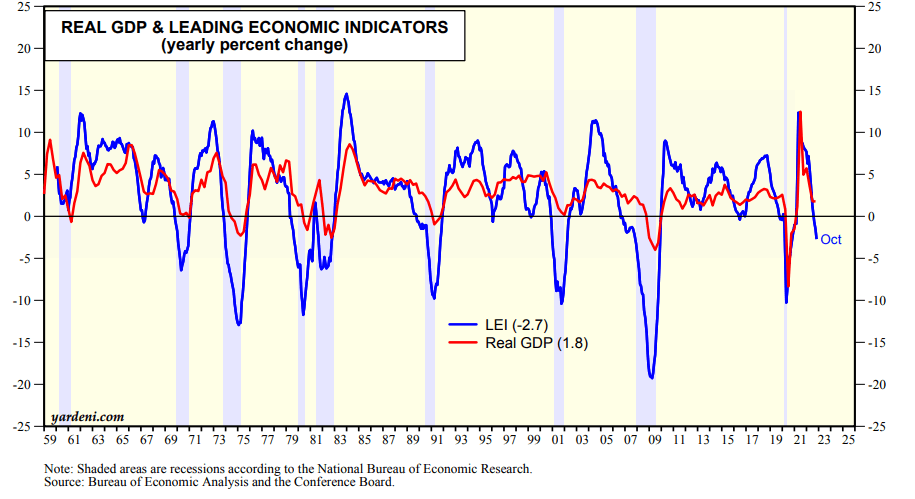
What’s more, the domestic Leading Economic Index (LEI) is flashing a warning sign right now. The LEI, published monthly by The Conference Board, is now negative in its percentage change from 12 months ago. Historically, such a drop has usually portended a recession. While the U.S. economy grew at an impressive 2.9% annualized rate in the third quarter, and as current jobs data and other readings like industrial production point to robust economic growth, leading indicators point to a possible recession during the first half of 2023. The consensus expectation among economists is indeed that a period of two quarters of negative real GDP growth is in the cards to start 2023.
Leading Economic Indicators Drop From a Year Ago, a Recession Harbinger
So, the mood on Wall Street and among portfolio managers around the world is not so sanguine despite what the spot VIX is telling us. Along with important financial planning tasks to check off your to-do list, investors and advisors might want to consider layering on some protective investments that can weather what could be more volatility ahead. Another portfolio safety play could be to lock in yield as the Fed could be forced to cut interest rates during the latter half of 2023 should an economic contraction take place. Now’s the time, after a strong, two-month rally to think about how much risk to take on in the new year.
Please see our Halo Disclaimer for other important disclosures.