Key Implications:
- High-yield securities can look attractive on the surface, but can have dangers underneath.
- Leverage, volatility, lack of diversification, and price-return problems can negatively impact total return.
- Two large players in the high-yield stock space are analyzed for their risk-adjusted return potential.
- Investors seeking to increase yield can achieve similar levels alongside diversification and downside protection by using Structured Notes linked to blue-chip indexes.
- A small group of simple Structured Notes are profiled as a high-yield replacement.
Investors who seek high yields are often attracted to securities such as Business Development Companies (BDCs) and leveraged Real Estate Investment Trusts (REITs). These securities promise attractive yields, but they come with risks such as price depreciation and volatility, which can lead to flat or negative returns. In this paper, we will make the case for replacing exposure to high-yield, high-leverage securities with diversified Structured Notes linked to assets such as the S&P 500 Index or the Russell 2000 Index.
Risks of High-Yield, High-Leverage Securities
While high-yield securities may offer attractive yields, they are not without risk. One of the biggest risks of high-yield securities is price depreciation, which can erode any yield advantage. Additionally, high-yield securities are often not diversified, which means they can be vulnerable to price shocks. For example, a leveraged REIT may be heavily invested in a particular type of real estate, such as office buildings. If the office real estate market experiences a downturn, the REIT’s share price could suffer.
Below are some examples which tell a similar story. First, BIZD is the VanEck BDC Income ETF, which seeks to track the performance of the MVIS US Business Development Companies Index. Over the past five years, the average trailing twelve-month yield has been 9.8%.
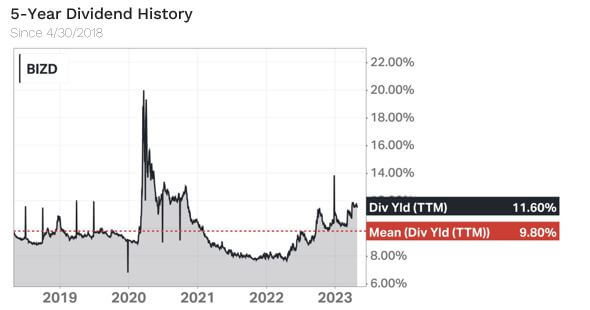
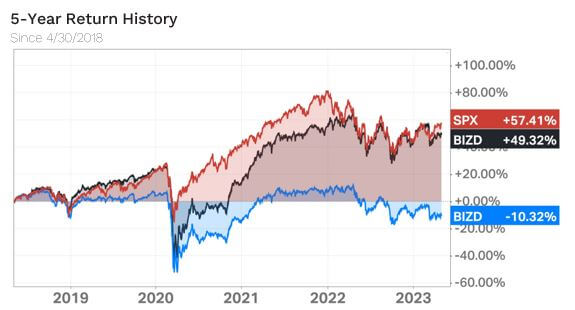
Despite that hefty yield, the total return has only amounted to 49.32% after being weighed down by a -10.32% price return. For context, this negative price appreciation occurred while the S&P 500 Index (SPX) was up 57.41%.
This dynamic is also apparent in the leveraged REIT space. One of the larger players in the area, AGNC Investment Corp., has boasted an 11.81% average yield over the past five years. (Past performances do not guarantee future results.)
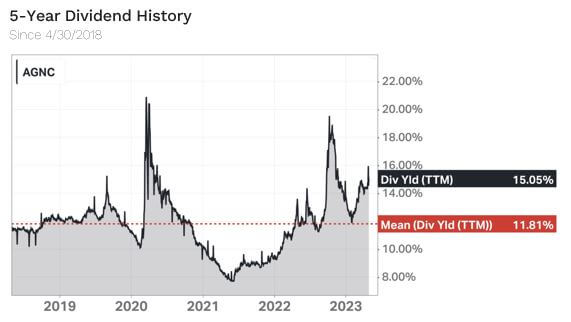
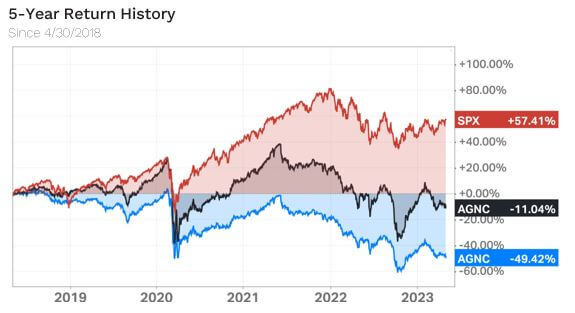
We’re sure it will come as a disappointment that this double-digit yield would’ve still lost investors money over a five-year bull run, with AGNC posting a -11.04% total return over that time.
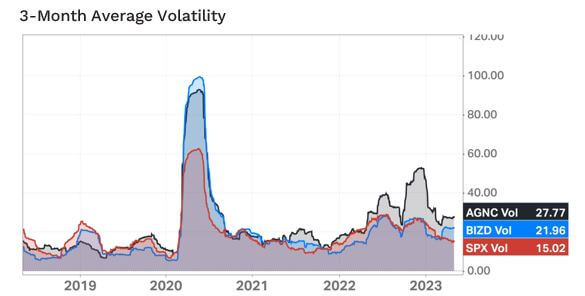
Moreover, high-yield securities are often more volatile than their lower-yielding counterparts, which can make them unsuitable for investors who cannot tolerate significant fluctuations in their portfolio’s value. Notice in the volatility chart below that AGNC and BIZD had a significantly higher peak than SPX during the early-2020 spike in volatility, signifying greater maximum risk potential. Further, there were a few periods when they posted sustained lower volatility than SPX.
Diversified Structured Notes linked to assets such as the S&P 500 offer several benefits over high-yield securities. First, they can provide similar yields. For example, the 3-Year Income Notes below have exposure to the S&P 500 with differing yields and protections:*
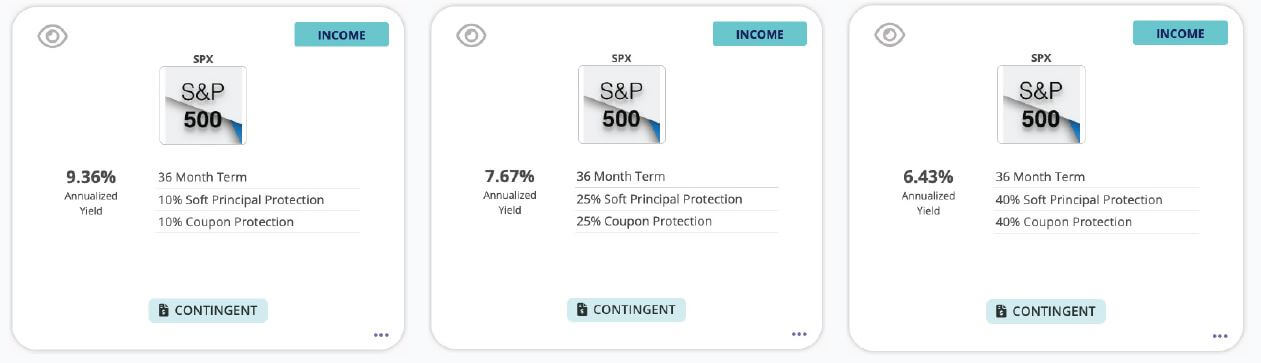
Hover to enlarge.
Examples are hypothetical and for illustrative purposes only. Indicative of pricing as of 5/2/2023. Changes to terms and pricing should be expected. The information does not constitute a recommendation from Halo Investing. There is no guarantee that these objectives will be met.
The progression of risk and return is clear: 10% downside protection yields 9.36%, 25% protection yields 7.67%, and 40% protection yields 6.43%. Structured Notes’ capacity to tailor risk and return is an advantage above and beyond the fully-exposed ETFs.
The next step for generating higher yield while remaining diversified is to involve other indexes in note construction. The hypothetical examples below are linked to the S&P 500 and the Russell 2000 with the same amount of downside protection.* Risk and potential reward are increased because the note’s performance is tied to the lesser performer of the two, called a “worst-of” note. That said, the S&P 500 and Russell 2000 are highly correlated to one another and are highly diversified stock indexes. Therefore, the overall risk is not significantly increased, but the potential reward is roughly 1% to 3% of additional annualized yield.
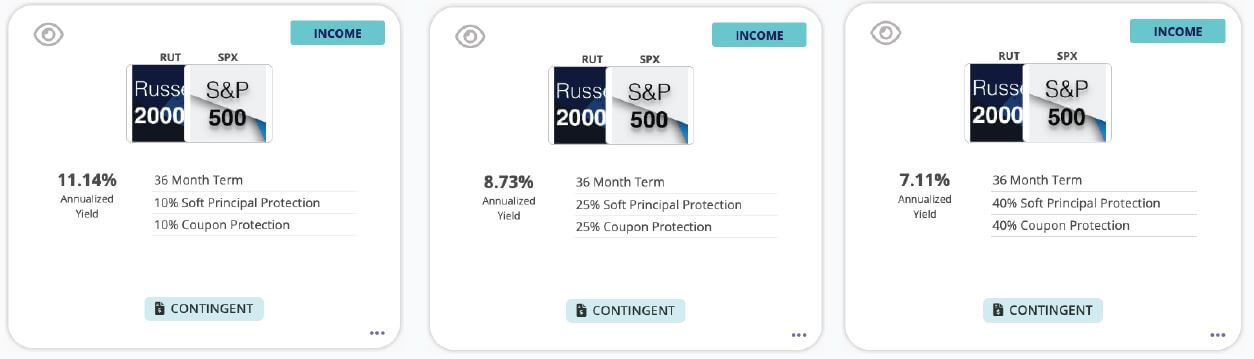
Hover to enlarge.
Examples are hypothetical and for illustrative purposes only. Indicative of pricing as of 5/2/2023. Changes to terms and pricing should be expected. The information does not constitute a recommendation from Halo Investing. There is no guarantee that these objectives will be met.
Applying the Bell-Curve Mentality to the Investments
Investing is a game of probabilities. We can’t know anything in the future with complete certainty, but we can use history and market mechanics to simulate hypothetical scenarios. By using capital market assumptions within a Monte Carlo simulation, we can generate an illustration of what could happen.
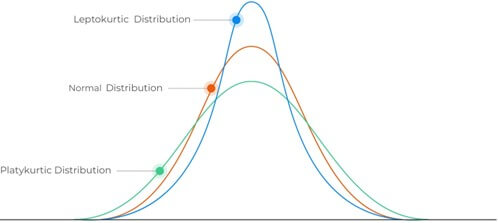
The bell-curve distribution that investors typically prefer is called “leptokurtic kurtosis.” That is a bell curve with a taller, narrower peak. A taller middle means shorter tails, signaling that extreme events are less likely. Generally, risk-conscious investors favor less extremes; leptokurtic bell curves offer that experience.
Kurtosis
The bell curve below displays a probability distribution of 3-year return outcomes, generated by a Monte Carlo simulation, for AGNC and Income Notes. The Income Notes are light blue and green, while AGNC is dark blue. Clearly, the potential outcomes for AGNC are much wider and, therefore, more uncertain.
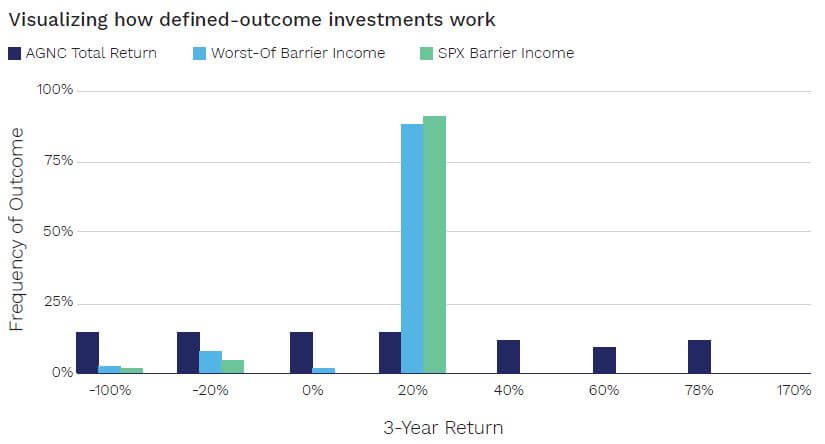
Simulated performance was not based on live results produced by an investor’s actual investing and trading, but was achieved by the application of a Monte Carlo simulation generated with long-term capital market assumptions. Fees, expenses, transaction costs, commissions, penalties, or taxes have not been netted from the gross performance results. The performance results do not include reinvestment of dividends, capital gains, and other earnings. Simulated performance does not reflect contemporaneous advice or record keeping by an investment advisor. Actual, live client results may have materially differed from the presented performance results.
The stark difference in outcomes is driven by the diversification of the underlying assets (a positive for Structured Notes), the downside protection element (a positive for Structured Notes), and the upside potential element (a negative for Structured Notes).
A diversified, less volatile asset will have a tighter distribution than an asset with single- stock risk, making the potential outcomes less extreme for the diversified asset.
Downside protection also tightens the distribution, because outcomes that fall within the protection threshold are shifted to the middle of the bell curve.
Upside potential also tightens the distribution, because Income Notes’ maximum return is the annualized yield. This means highly positive outcomes for the Structured Notes’ underlying assets are shifted left.
In summary, investors who are willing to sacrifice the right tail of extreme positive returns for AGNC can generate a significantly higher consistency of double-digit returns with Income Notes.
Conclusion
High-yield securities such as BDCs and leveraged REITs may offer attractive yields, but they come with risks such as price depreciation, volatility, and lack of diversification.
Diversified Structured Notes linked to assets such as the S&P 500 or the Russell 2000 can provide similar yields without the risks associated with the undiversified securities.
Additionally, Structured Notes offer a level of downside protection, which make them a compelling alternative for investors who seek to tailor their portfolios’ risk at a higher level. The end result for replacing highly-leveraged, high-yield securities with diversified Income Notes is the capability to generate similar yields with significantly less uncertainty and risk, leading to a higher potential for successful portfolio outcomes.
Please see our Halo Disclosure Page for important disclosures.
The information provided here is neither tax nor legal advice and should not be relied on as such. Investment involves risk including possible loss of principal.
FOR INSTITUTIONAL, FINANCIAL PROFESSIONAL, PROFESSIONAL INVESTORS, AND WHOLESALE INVESTOR USE ONLY. This communication should not be distributed, in its current form, to end-investors, and it is for investment professionals only.
The material is for information purposes only. It is not intended for and should not be distributed to, or relied upon by, members of the public.
It is not intended to be a forecast, research or investment advice, and is not a recommendation, or an offer or solicitation to buy or sell any securities or to adopt any investment strategy. The opinions expressed are subject to change. References to specific securities, asset classes and financial markets are for illustrative purposes only and are not intended to be and should not be interpreted as recommendations. Reliance upon information in this material is at the sole risk and discretion of the reader. The material was prepared without regard to specific objectives, financial situation or needs of any investor.
Past performance is not a reliable indicator of current or future results.