We’re regularly asked how Structured Notes work or why someone should use a defined-outcome investment. While this question has many answers, the short version generally boils down to their ability to help shape an investment’s return profile in ways few, if any, other investments can.
By concentrating the range of investment outcomes, they have the potential to deliver a more predictable return pattern, which can help improve the overall investment experience while helping mitigate some behavioral biases known to creep in when investments jump out of line.
For obvious reasons, investment returns get a lot of attention. Interestingly, if not unfortunate, the shape or disruption of returns get a lot less attention. This brief note will explain how savvy investors understand this and take advantage with some relatively simple portfolio hacks.
Tilting the Tables In Your Favor
There are many ways to invest, from passive index funds and ETFs, to active mutual funds. Most of these products are designed to deliver a symmetrical return distribution, whereby an investor is exposed “symmetrically” to gains and losses. Said another way, as an investment goes up or down, the investor participates in these gains and losses one to one.
The following video offers a simple yet entertaining way of visualizing this relationship.
Since recognizing the odds of the market going up or down are not equal, a lot of investors prefer to deviate from the symmetrical 1:1 exposure constraints of most vanilla financial products. With a little creativity, options, derivatives, Structured Notes, and similar defined-outcome investments can efficiently bend or shape a standard investment’s, such as the S&P 500’s, payoff profile in ways that target a more desirable up/down capture.
Some might wonder why an investor would want to do this? Without diving into the math, Figure 1 can help illustrate this for us. The middle chart represents the familiar bell-shaped return distribution generally used to describe traditional investments or asset classes. This distribution’s hallmark feature is its symmetry, where the return distribution is approximately identical above and below the mean. This is called the standard normal distribution, and much ink has been spilled debating whether financial markets actually follow a normal distribution.
Figure 1: Hypothetical Return Distributions

We won’t go down that rabbit hole here, but by casually observing markets we see that they’re often far more lumpy than assumed by the normal distribution. Booms, busts, greed, fear, bubbles, and too many other things to list here often leave markets with return distributions that are far from symmetrical.
Skew and kurtosis can help us capture these effects. Don’t worry, no math will be applied here. Skew describes how much a return distribution leans to the left or right, while kurtosis measures how “fat” or “thin” the tails of a distribution are. Figure 1 also illustrates this. Here we see the return distribution deviating from the assumption of normality (or symmetry), and the return distributions are clearly asymmetrical in nature.
To get a sense of skew and kurtosis for some common indices, Figure 2 describes the skew and kurtosis for the S&P 500, Nasdaq-100, Russell 2000, and the Dow Jones Industrial Average. Readers are reminded, the normal distribution assumes a skew of 0.0 while kurtosis is assumed to be 3.0. We see that from each of these benchmark’s inception dates, each has a negative skew (i.e., greater downside outliers). The Russell 2000, S&P 500, and Nasdaq-100 each have a kurtosis value less than 3.0, indicating that these indices have thinner tails than the normal distribution, which suggests a slimmer likelihood of extreme moves higher or lower. The Dow, with a kurtosis greater than 5.0 exhibits “fat tails,” with more large up (down) outliers than a normal distribution.
Figure 2: Skewness and Kurtosis by Asset
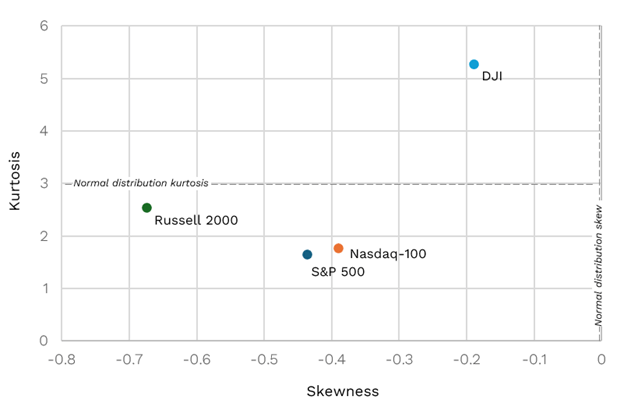
While no two investors are identical, generally speaking, investors prefer positively skewed distributions with low kurtosis. This stems from behavioral finance and Prospect Theory, which suggests that investors may be more sensitive to losses than gains. As we can see from Figure 2, several of the most common investment benchmarks in the world all have historical return distributions which are notably less than symmetric, with a more undesirable left-skewness.
And here’s where it gets interesting. A lot of investors, perhaps even you, might say “who cares, too much math,” and otherwise ignore any consideration of skew or kurtosis when selecting an investment or building a portfolio. On some level this is understandable, but whether you know it or not, we’re all making a call on an investment’s potential skew or kurtosis whether explicitly or implicitly when investing in anything. Even when buying the simplest of passive index funds on the S&P 500, you’re making an implicit call on the index’s potential return distribution.
Targeting a Better Investment Experience with Structured Notes
To help illustrate how Structured Notes can help shape a more desirable return profile, we’ll use the simplest of investments, the S&P 500. Figure 3 illustrates the annual returns for the S&P 500 for the past 154 years.
Figure 3: U.S. Stock Market Returns – 1871 to 2024
Distribution of 1-Year Returns (Total Real Return)
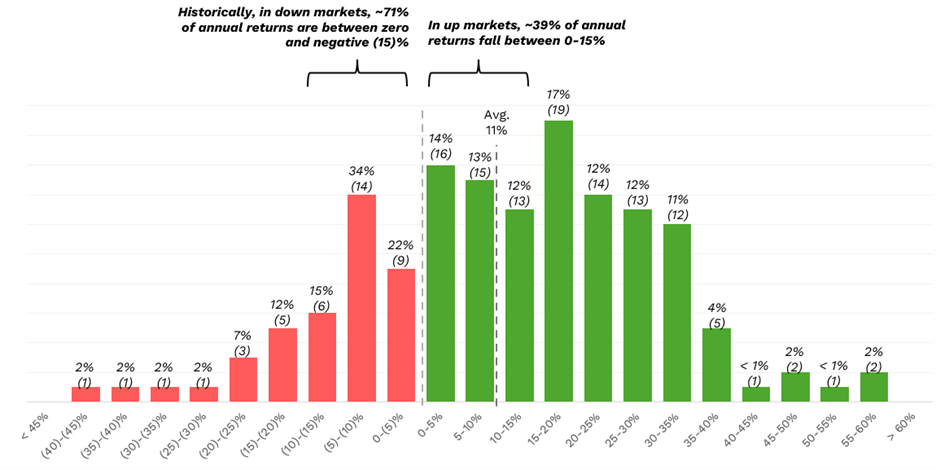
We quickly see that a majority of returns are centered around the mean (or average) of 11%. This is to be expected. While we all love a blockbuster year, they’re rare and on some level, we should expect a return from one year to the next to be far closer to the average. In terms of probabilities, we’d say there’s a high probability that annual returns will be near the average, and a low probability that they’re going to be greater than 30% or more for the year. These numbers bear this out.
If you invested in the S&P 500 and assumed returns (whether you know it or not) followed a normal distribution, you’re effectively accepting there’s an equal probability the index would go up (down) by the same amount over some time period. Said another way, assuming normality, the probability that the S&P 500 would go up 5% is the same as the probability that it would go down 5%.
For some investors, this naive approach is fine and we make no endorsement one way or another. But for a lot of investors, assuming the probability of advances is the same as the probability of declines is unacceptable. This is where defined outcomes and Structured Notes can shine.
Through the use of options and other derivatives, Structured Notes allow for the investment in familiar products, such as the S&P 500, but allow investors to structure a return payoff that’s more desirable. For example, perhaps in agreement with the historical return frequencies in Figure 3, an investor may wish to shape an investment in the S&P 500 around advances (or guard against declines) with the highest probability of this happening. A capped Growth Note with a 15% downside buffer could make an ideal candidate. But to be clear, Structured Notes can be designed in nearly countless ways. This is but one example of many possibilities.
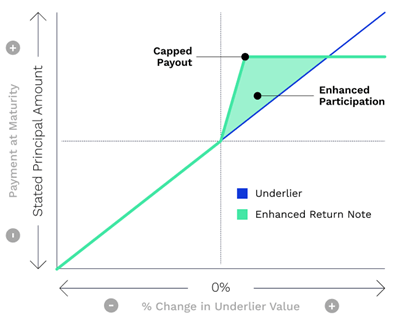
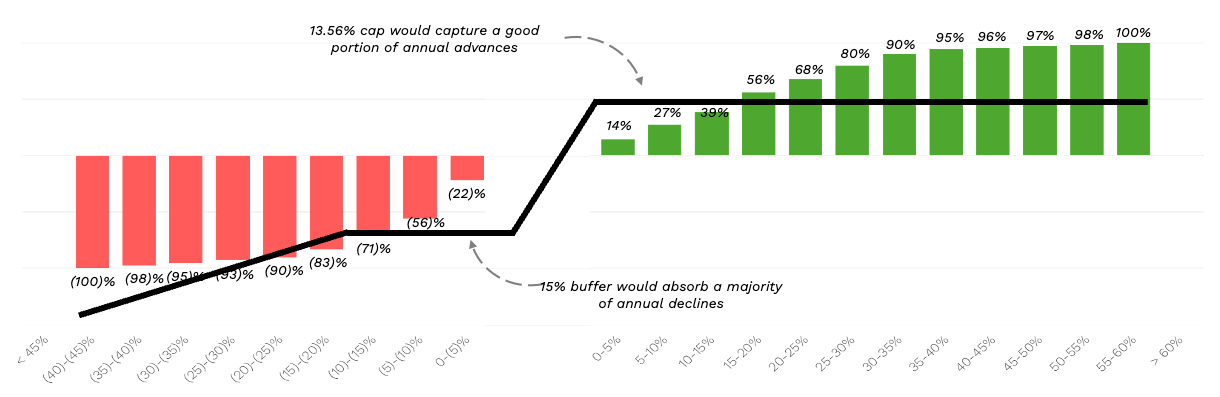
For illustrative purposes, Figure 4 provides indicative terms and pricing for such a Note. Figure 5 offers a hypothetical payoff diagram for this Note. In this example, we see the Note’s return is capped at 13.56%. To the downside, the Note absorbs the first 15% of losses and participates 1:1, less the buffer percentage with the underlier, for any loss beyond the buffer level. Say, for example, the S&P 500 is down 18% at maturity, this Structured Note would only be down 3% (18% less 15% buffer) (subject to the credit risk of the issuer).
Figure 4: SPX Growth Note Example
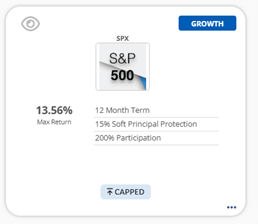
Figure 5: Payout For Hypothetical Structured Note with Capped (Max) Return
Here’s where critics often misrepresent Structured Notes. In this example, yes, the Note’s potential gain is capped, but the cap is high enough so as to capture nearly half of the historical one-year returns of the S&P 500. In exchange for sacrificing some upside potential, downside protection is added, and in this example, the 15% buffer absorbs nearly 70% of the historical one-year losses.
In Figure 6, If we superimpose the Structured Note’s payoff diagram with the historical annual return of the S&P 500, we can begin to see the potential in defined-outcome investing. From our example, while capped, the Note’s return potential generally aligns with where most of historical returns have fallen. And on the downside, once again, the 15% buffer has the potential to absorb a large chunk of where most annual declines have occurred.
Figure 6 U.S. Stock Market Returns – 1871 to 2024
Distribution of 1-Year Returns (Total Real Return) with Hypothetical Payout for Structured Note Identified in Figure 4
The Bottom Line
Missing out on gains is never easy and advisors have a tough job in today’s FOMO-driven market, which to no surprise is why you’re always apologizing for diversification — the only free lunch in investing.
This example helps demonstrate how Structured Notes and defined-outcome investing can help tilt an investment’s return potential to your advantage. Market-linked products such as Notes allow investors to participate in potential market advances and generally, in exchange for giving up some upside potential, mitigate downside risk as well.
Please see our Halo Disclosure Page for important disclosures
An investment in Structured Notes may not be suitable for all investors. These investments involve substantial risks. The appropriateness of a particular investment or strategy will depend on an investor’s individual circumstances and objectives.
Content and any tools discussed are provided for educational and informational purposes only. Halo Investing makes no investment recommendations and does not provide financial, tax, or legal advice. Any structured product or financial security discussed is for illustrative purposes only and is not intended to portray a recommendation to buy or sell a particular product or service.
US353/1.0/2506