Key Takeaways:
- The S&P 500 rallied 5% in May to notch a new record, led by AI tech stocks
- Oil hit a 4-year high before easing into month-end, but rising inflation stings consumers
- New risks emerge, both long- and short-term, making risk management all the more important after the S&P 500’s best 2-month gain since 2020
Stocks surged again in May. The S&P 500 jumped 5.2%, adding to April’s 10% advance. The Nasdaq Composite led the way, tacking on 8.4% to its sharp V-shaped recovery since the March 30 low. Indeed, the Information Technology sector launched 15.9% last month, marking its best two-month rally since 2002.
Legacy tech (not the Magnificent Seven) drove massive May gains. Names like Micron (MU), SanDisk (SNDK), Intel (INTC), Dell Technologies (DELL), Qualcomm (QCOM), and IBM (IBM) were in favor. But it wasn’t an equity all-skate by any means. In fact, eight of the 11 S&P 500 sectors finished the month negative, with Utilities and Energy sliding the most.
S&P 500 +16% in April-May, Best Rally Since 2020
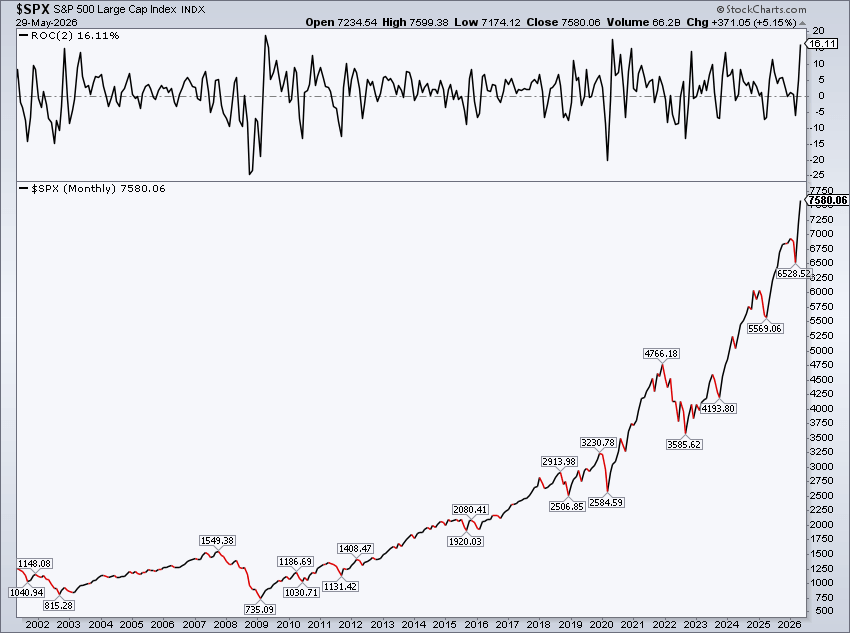
Source: Stockcharts.com
The Market Is Betting on Lower Oil Prices
As the conflict in Iran enters its fourth month, all eyes remain on the Strait of Hormuz and social media posts from President Trump and Iranian sources. For now, the market seems to be sniffing out a truce, given sizable declines in domestic WTI and global Brent crude oil. The former shed 16% in May, while the latter lost 17%.
For U.S. commuters, hope may be on the horizon. The national average price for a gallon of regular unleaded dipped toward $4.30 by May’s finish, about a quarter below its year-to-date peak. Futures pricing suggests lower gas prices as the year progresses.
Gas Prices Finally Falling, But Remain High
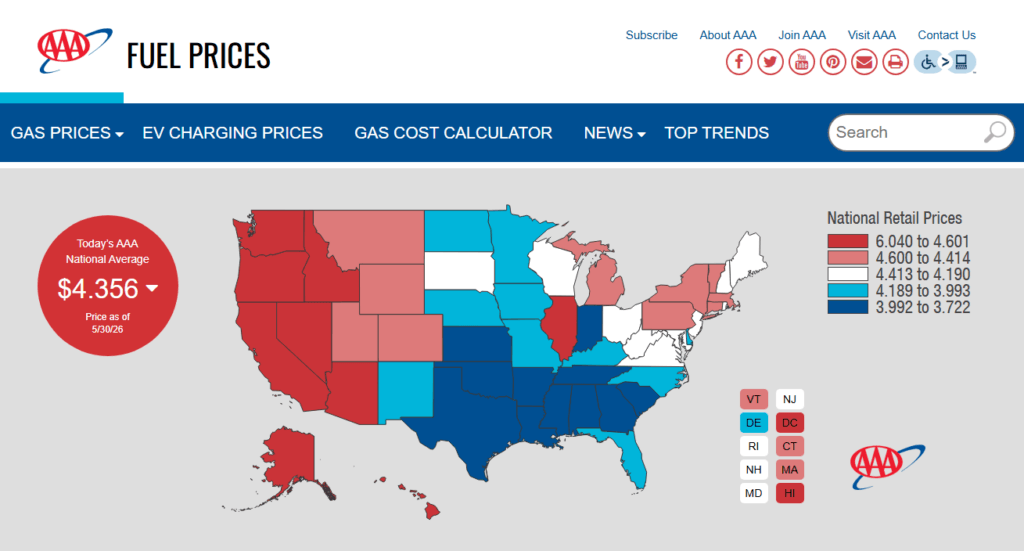
Source: AAA
The Diversification Problem
Uncertainty remains high, however, and that goes for the commodities and bond markets alike. Perhaps the standout chart of Q2’s middle month was the delicate dance between equities and fixed income, and its implication for supposedly diversified investors.
In technical terms, the trailing three-month stock-bond correlation reached multi-decade highs. For everyday investors saving for, preparing for, and living in retirement, that means one thing: more portfolio volatility.
Stocks Up, Bonds Up; Stocks Down, Bonds Down
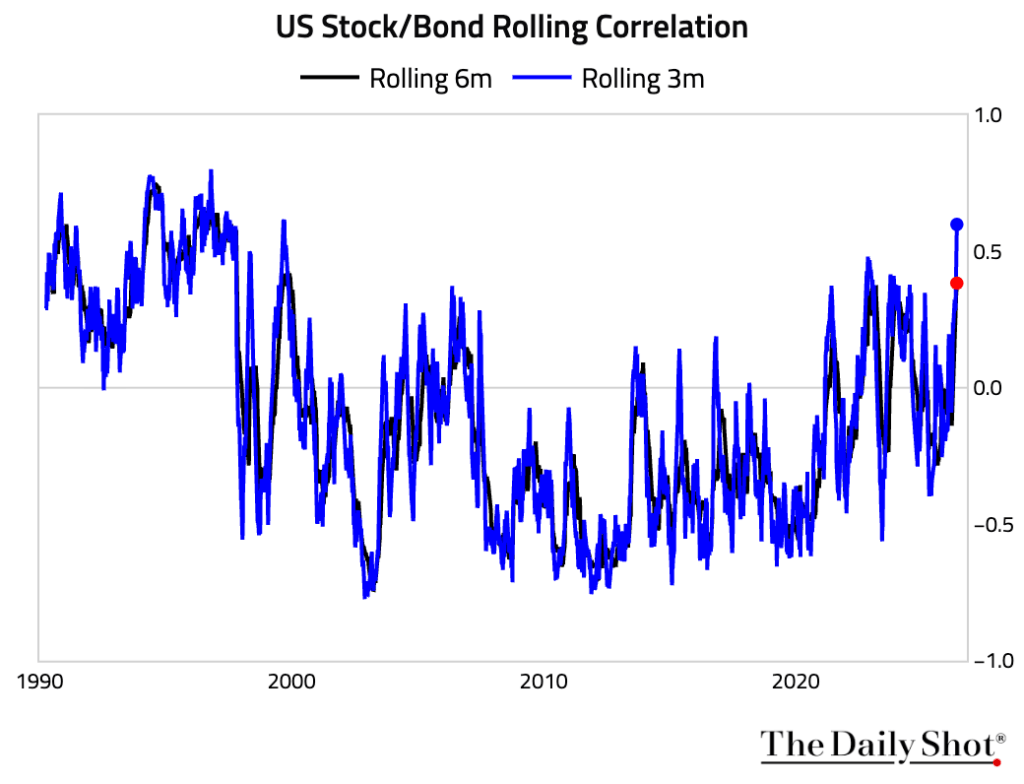
Source: The Daily Shot
When Bonds Matter More Than Stocks
It’s not a new phenomenon. Ever since the great bond bear market of 2022, the S&P 500 has buckled when Treasury yields have risen sharply and moved above key levels.
Remember that when interest rates rise, bond prices fall. So, when yields jump, equities often decline. Speed, direction, and levels all matter when it comes to the stock-bond relationship. We have absolutely seen periods in which global equities perform fine when rates creep higher on good economic news. Volatility spikes, though, when institutional investors collectively dump global bonds. That has occurred frequently since early March.
Oil, Inflation, and the Bond Vigilantes
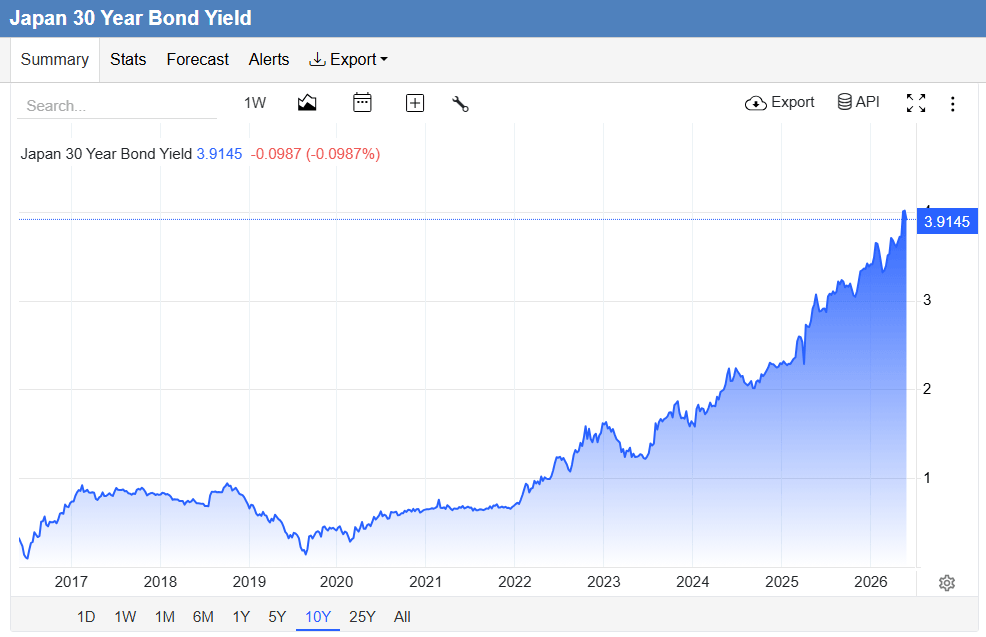
Another intermarket relationship during inflationary regimes (like the one we are living through today) is that higher commodity prices often coincide with higher interest rates. As WTI and Brent scaled one new high after another in the first half of Q2, interest rates in Japan, Australia, Germany, the United Kingdom, and, yes, the USA all stair-stepped higher.
In mid-May, Japan’s 30-year yield thrust toward a record 4.2%. Benchmark yields in Asia and Europe followed suit. Fortunately, oil’s drop by month’s end helped tame the so-called “bond vigilantes.”
This is why what’s going on in the Middle East is so important. It’s not just about paying a few bucks more at the pump. It’s about how retail investors’ portfolios are at risk from the very real effects of today’s inflationary environment. It’s no longer an academic study, but a real-world risk to traditional portfolios.
A Global Bond Selloff Bears Watching: Japan’s 30-Year Hits a Record High
Source: Trading Economics
How Expensive Are Stocks?
Something else to question is today’s equity market valuation.
We checked, and through May, six S&P 500 stocks had more than tripled on the year. Another half-dozen had doubled year to date. The list is chock-full of legacy tech memory and storage companies, as the AI revolution seeps into other niches of the tech enterprise world.
Big picture, the “Shiller P/E,” also known as the Cyclically Adjusted Price-to-Earnings (CAPE) Ratio, on the S&P 500 reached 42.7x at month’s end. It’s not a near-term market-timing tool, but the current level rivals historical extremes.
For investors thinking about valuation risk, Growth and Income Structured Notes are one vehicle worth understanding because they offer a defined risk/return profile. However, in exchange for down-side protection or fixed income, investors must accept the credit risk of the issuing financial institution and a lack of daily liquidity before maturity. Always monitor your macro risk and, over time, potentially diversify into notes that may more effectively buttress an existing portfolio.
Shiller CAPE Ratio Now Rivals the Dot-Com Bubble High
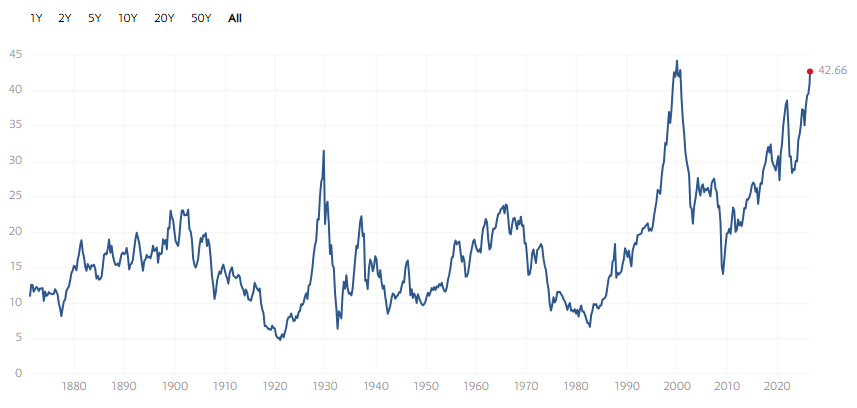
Source: Multpl.com
Don’t Fight the Trend
Candidly, we are not market timers at Halo. Like any good investor, however, we are mindful of risks. As we called out a month ago, risk goes in both directions. Volatile, upward price action is awesome, and that’s what most investors have experienced since March 30. Moreover, it’s not just the S&P 500 and Nasdaq on the rise. Corporate profits are increasing at a rate not seen in years.
The AI revolution is driving a massive wealth transfer from large tech company balance sheets to the revenue lines on income statements among smaller AI enablers. Throw it all in a macro blender, and forward S&P 500 earnings-per-share growth is north of 20%, pacing at the highest clip since 2021. And while the CAPE ratio is in nosebleed territory, the standard S&P 500 P/E multiple stands at a less jarring 21.2x heading into June. Wall Street sees record profit trends over the quarters ahead, too.
Thus, dying on the market-valuation hill right now might carry more risk than reward, and making wholesale portfolio changes at the flip of a switch is probably not the right strategy either.
S&P 500 Earnings Estimates Keep Climbing, Suppressing the P/E Ratio
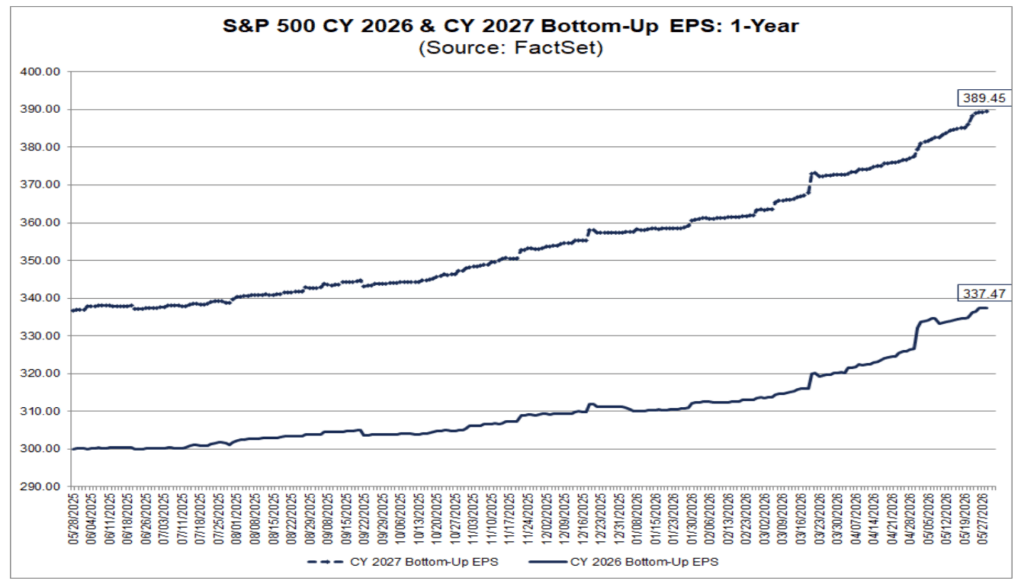
Source: FactSet
A New Fed Chair Takes the Stage
AI, Middle East geopolitical tensions, and stock market valuations are all top of mind today. Also front and center are changes at the Fed.
Last month, Kevin Warsh was sworn in as the 17th chair of the Federal Reserve Board of Governors. The attorney and former Fed governor succeeds Jerome Powell in leading the Federal Open Market Committee (FOMC). Powell broke with tradition and opted to remain as a voting governor on the FOMC, a decision that has attracted its share of commentary among market watchers.
Will History Repeat?
Here’s why this matters for investors: The market tends to test new Fed chairs. Historically, Treasury rates have scooted higher shortly after a rookie Fed chief assumes command. It remains to be seen if the old Wall Street rule of thumb plays out this time around, but market watchers will pay extra attention to how the benchmark 10-year Treasury yield behaves over the summer and leading into the midterm elections.
As a reminder, stocks have been most volatile during midterm years. In such years since 1950, the median S&P 500 intrayear decline is 15.6%, which is slightly higher than average. Recall 2022’s 24.5% drawdown, along with bear-market-like returns in 2018, 2002, and 1998. It looked like we might get that big drop as the Iran war broke out a few months ago, but the January-March dip was actually less than 10%.
Midterm Year Risk: Significant Drawdowns, On Average
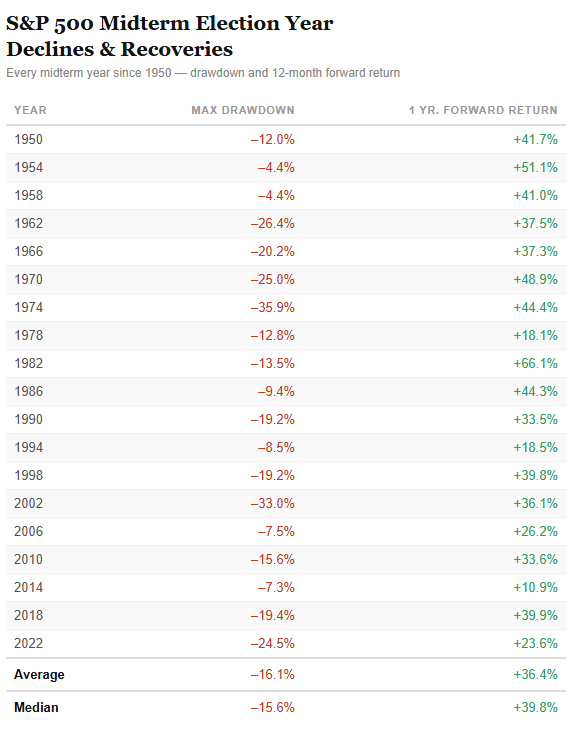
Past performance is not a guarantee of future results.
The Bottom Line
Investors have been tested across asset classes this year. Four-year-high inflation is the real-world impact of rising oil prices and interest rates, while the stock market remains resilient amid the AI boom. With stock-bond correlations at multi-decade highs, equity valuations near historical extremes, and midterm election seasonality ahead, a measured allocation approach, including protective investment strategies, may be well suited for what’s coming.
Disclosure
An investment in Structured Notes may not be suitable for all investors. These investments involve substantial risks. The appropriateness of a particular investment or strategy will depend on an investor’s individual circumstances and objectives. Structured Notes are subject to the credit risk of the issuing financial institution and may have limited or no secondary market liquidity. Investors may lose some or all of their principal.
Content and any tools discussed are provided for educational and information purposes only. Halo Investing makes no investment recommendations and does not provide financial, tax, or legal advice. Any structured product or financial security discussed is for illustrative purposes only and are not intended to portray a recommendation to buy or sell a particular product or service.